Reno/Sparks Active vs. Sold Report: February 2023
What’s happening with the real estate market in our area? We hope to make it easier to understand by breaking down the numbers and finding the trends so you can make informed decisions about buying and selling.
Click here to enlarge the graph
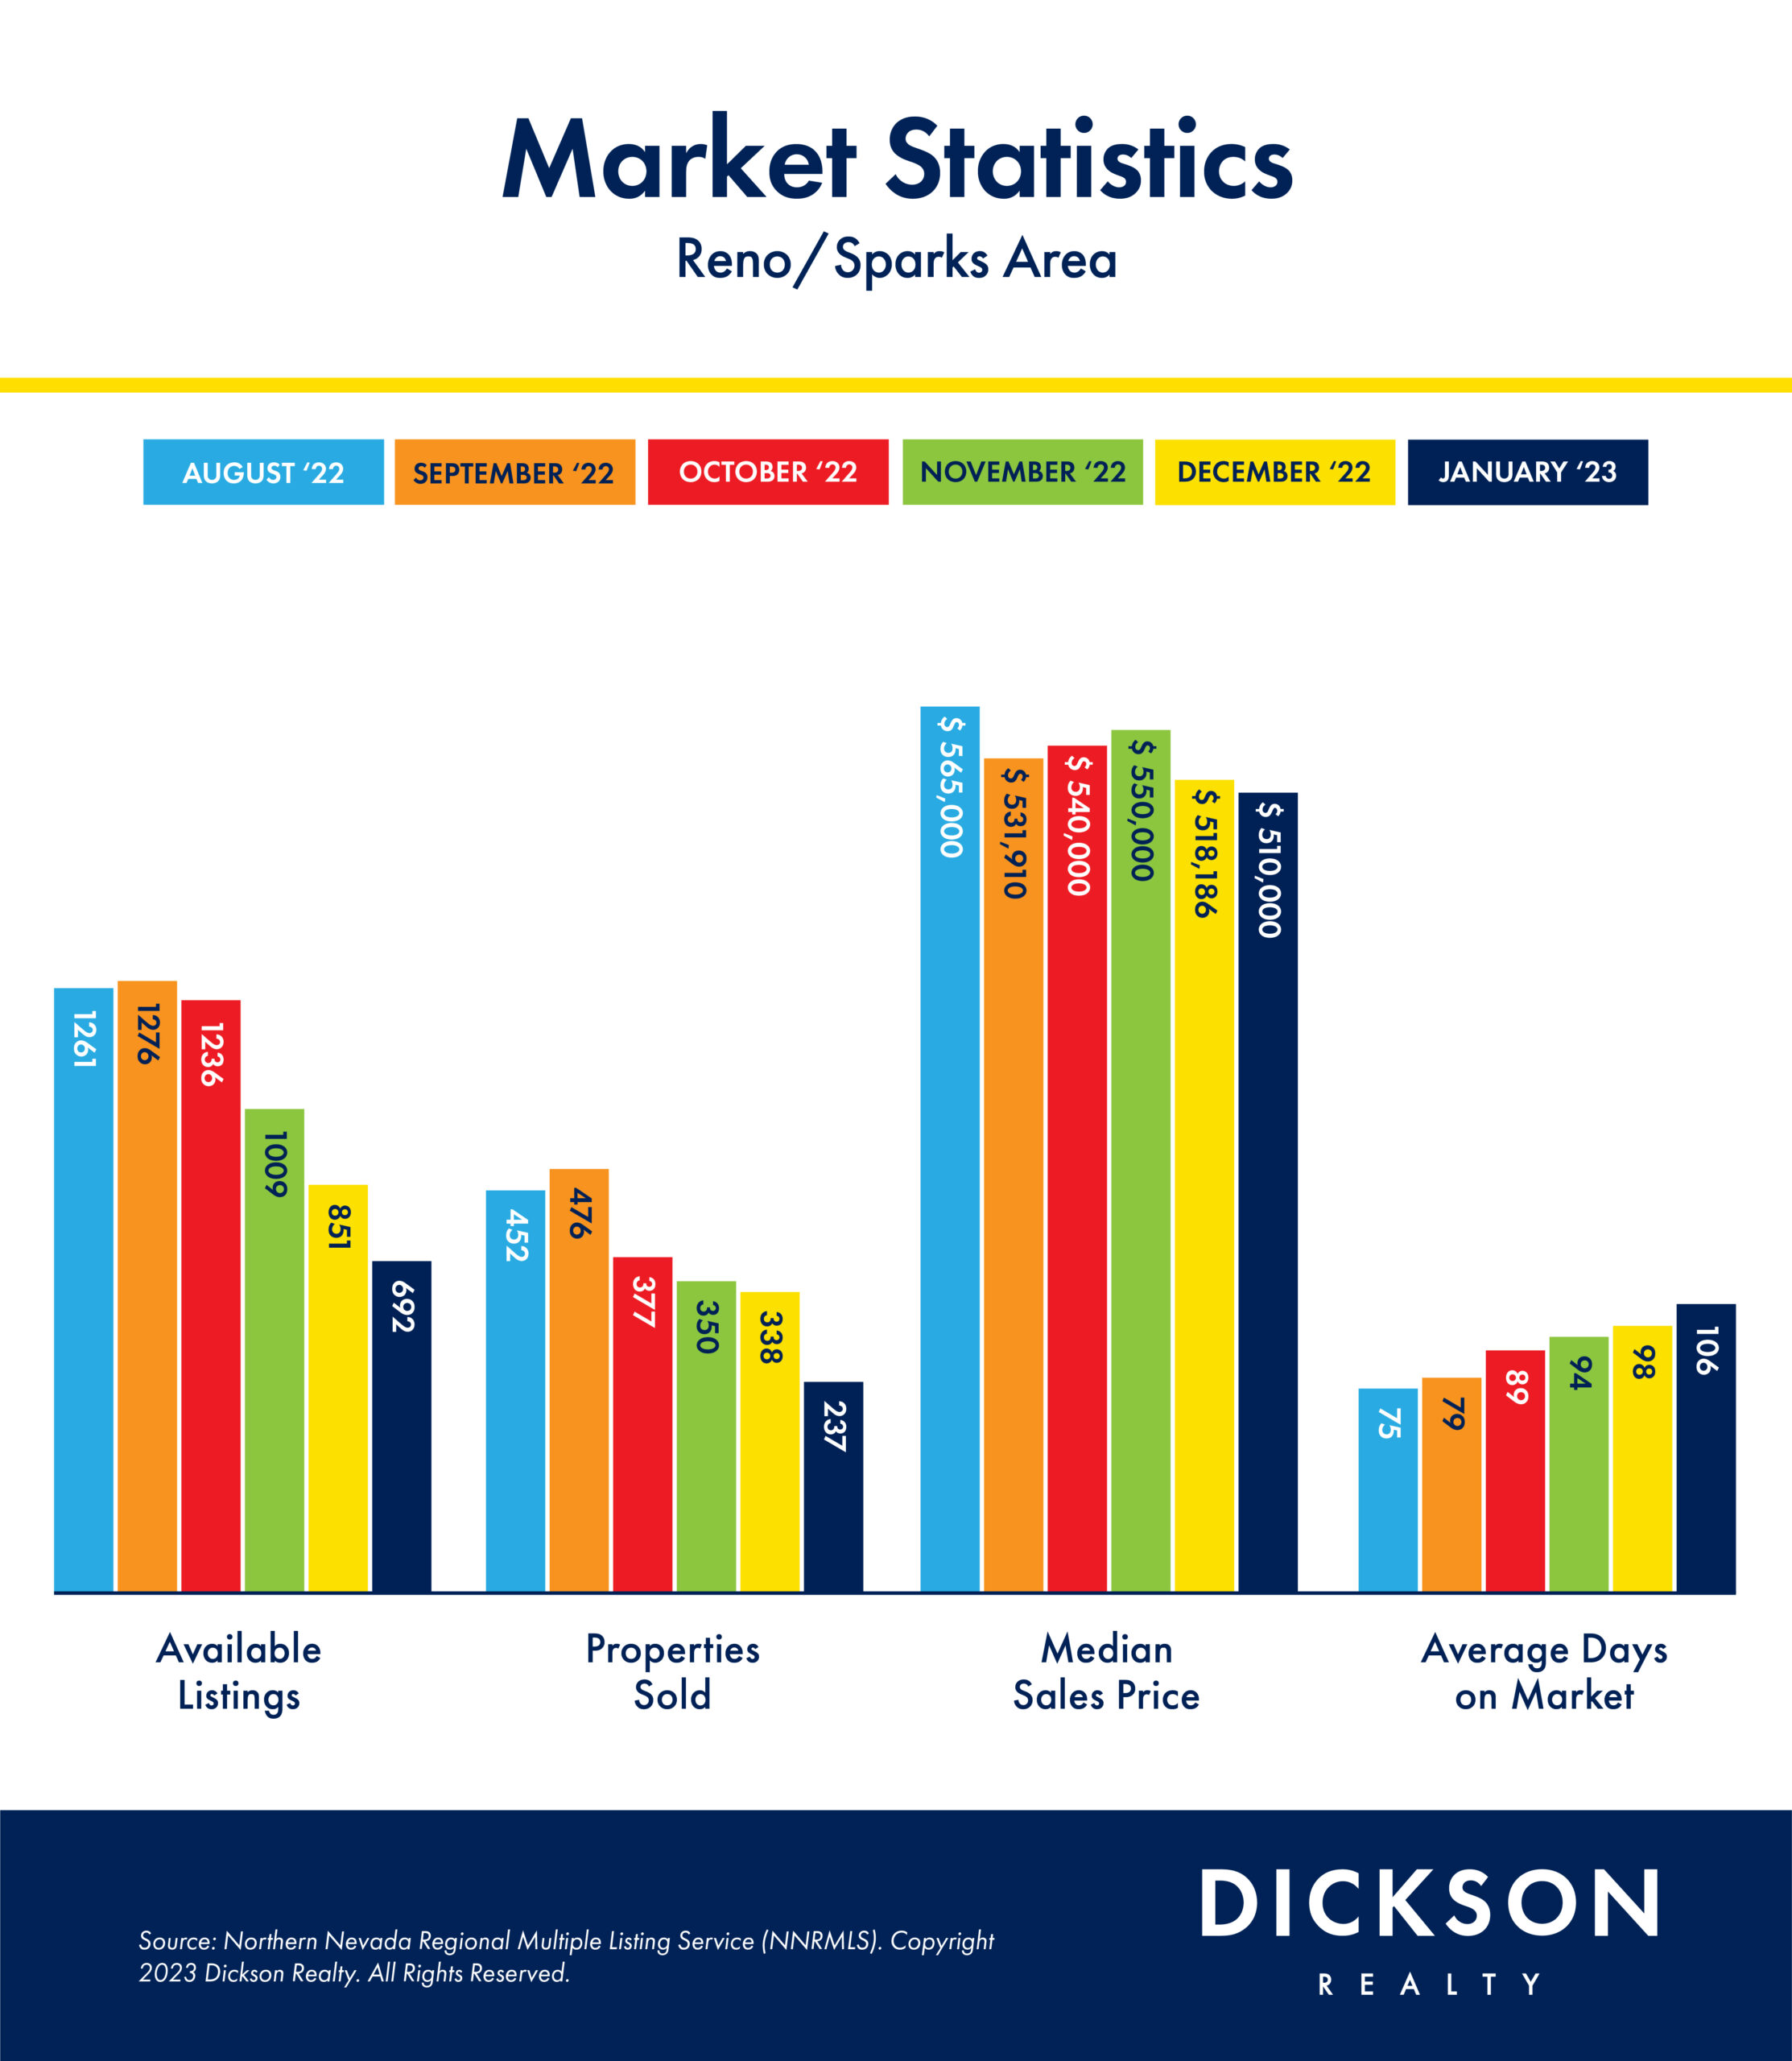
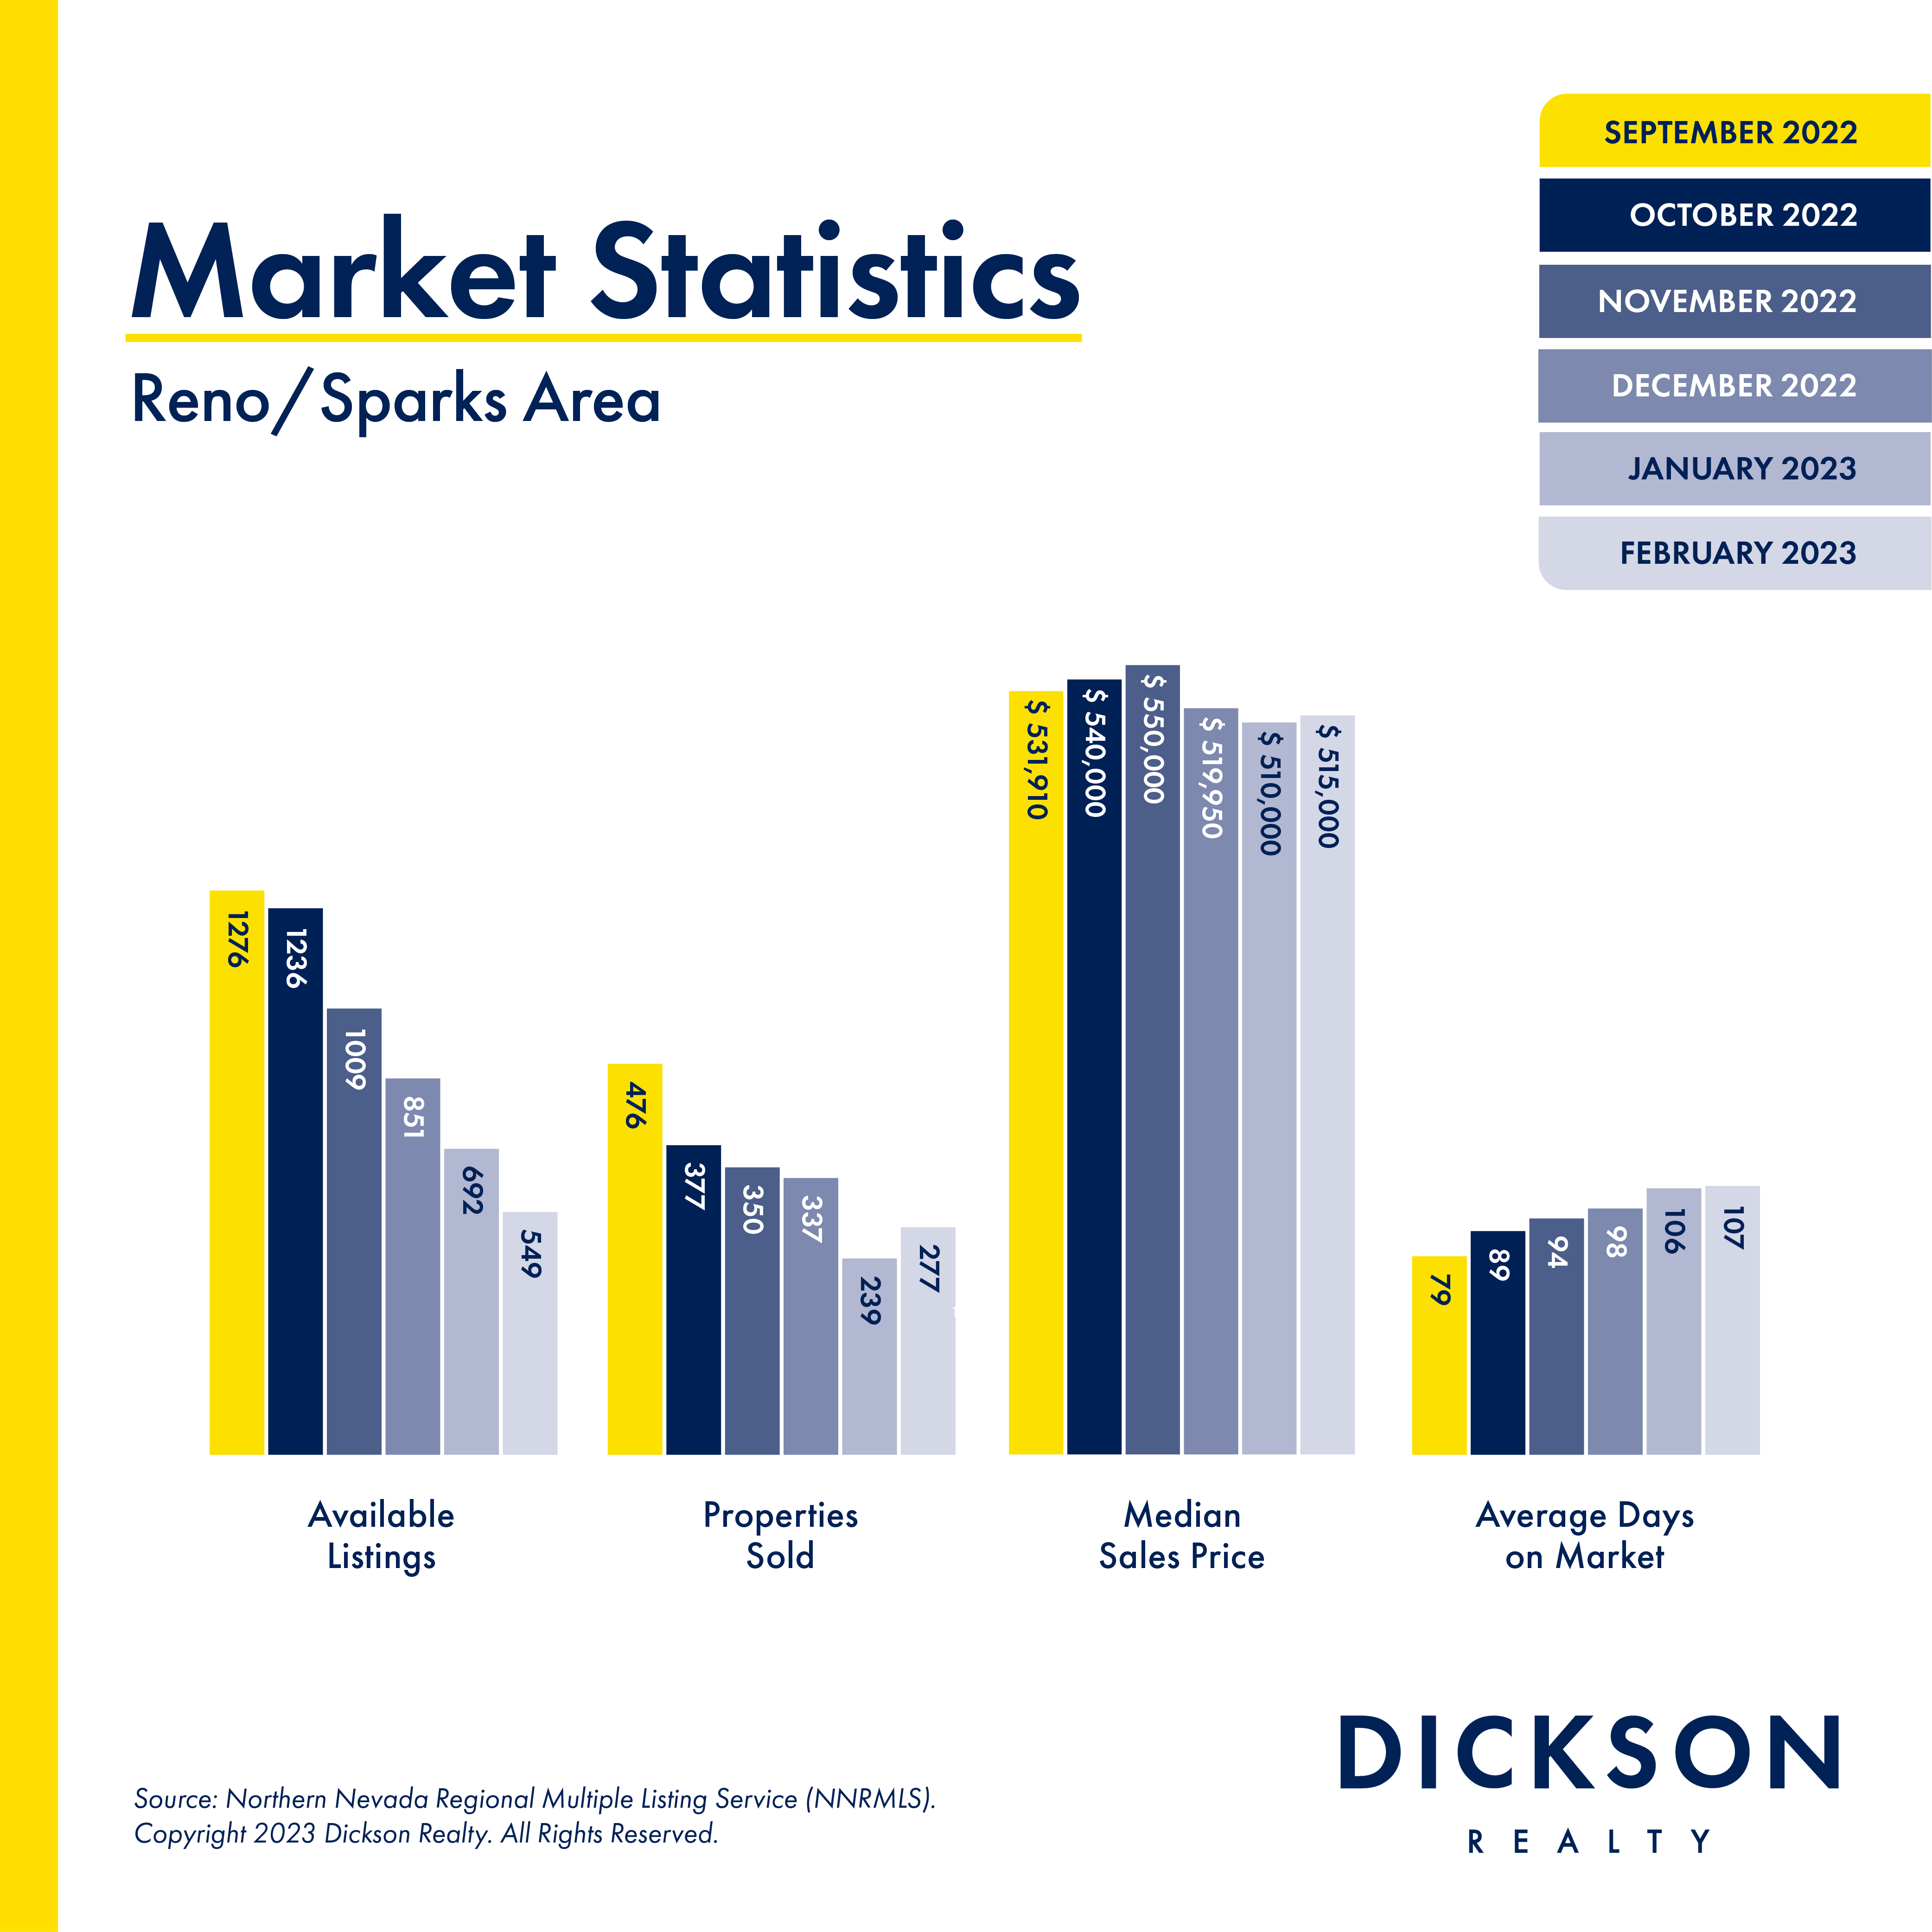
There were 692 homes active on the market and available for purchase (not in contract or escrow) at the end of January, which is an 18.7% decrease from the end of December. Despite the month-over-month decrease, active/standing inventory has increased by about 200% year-over-year. This yearly increase sounds dramatic, but we were in a severe inventory shortage in 2020 and 2021, and we are still not yet back to normal levels of inventory that represent a healthy market. More listings means that buyers have more time to make a decision, and homes take longer to get into contract. This is not a bad thing and is welcomed relief for home buyers in our region, many of whom have been unable to purchase in recent years because of the intense competition.
Reno/Sparks area REALTORS sold 237 single-family homes in January, which was a 30% decrease from December and a 41% decrease from the exceptional number of sales in January 2022. 237 sales is the lowest number of sales in a given month in at least the last 10 years. Higher interest rates tempering buyer demand combined with the normal seasonality of the market in January best explain the decreased number of sales this past month.
The median sales price for single-
Average Days on Market for January increased by 8.2% over the last month to 106 days. It also increased by 47% compared to this time last year, putting us back to 2018 and 2019 market times. Another marker of market time is Days to Contract; here we see an average of 57 days from initial listing until a home goes into contract. We’ve talked about getting back to “normal” market conditions for the past several months, and we are seeing that now with the increases in time on market. The last time average days on market were above 100 days was January of 2020.
With seemingly ever-changing market conditions and mortgage rates it is more important than ever to be pre-qualified with a lender before looking at homes to buy and to have an expert REALTOR assist you with navigating the negotiations when making a home purchase.
If you have any questions about this report or would like to speak with a lender about getting pre-qualified, please feel free to call or text. It would be a pleasure to assist you.
